
ntop is a network traffic tools that shows network usage in a real time. One of the good things about this tool is that you can use a web browser to manage and navigate through ntop traffic information to better understand network status.
ntop (stylized as ntop) is computer software that probes a computer network to show network use in a way similar to what the program top does for processes. In interactive mode, it displays the network status on the user's terminal. In Web mode, it acts as a web server, creating a HTML dump of the network status. It supports a NetFlow-sFlow emitter-collector, a Hypertext Transfer Protocol (HTTP) based client interface for creating ntop-centric monitoring applications, and RRDtool (RRD) for persistently storing traffic statistics.
ntop is available for both Unix and Win32-based platforms. It has been developed by Luca Deri, an Italian research scientist and network manager at University of Pisa.
Common usage on a GNU/Linux system is to start the ntop daemon (/etc/init.d/ntopd start), then one can use the web interface to ntop via visiting http://127.0.0.1:3000 provided the loopback device has been started (/etc/init.d/net.lo start) and the listening port for ntop is 3000 (look out for the -w option in ps aux | grep ntop).
Also Ntop monitors and reports hosts traffic and supports these protocols:
TCP/UDP/ICMP
(R)ARP
IPX
DLC
Decnet
AppleTalk
Netbios
TCP/UDP

Figure: ntop installation


ntop (stylized as ntop) is computer software that probes a computer network to show network use in a way similar to what the program top does for processes. In interactive mode, it displays the network status on the user's terminal. In Web mode, it acts as a web server, creating a HTML dump of the network status. It supports a NetFlow-sFlow emitter-collector, a Hypertext Transfer Protocol (HTTP) based client interface for creating ntop-centric monitoring applications, and RRDtool (RRD) for persistently storing traffic statistics.
ntop is available for both Unix and Win32-based platforms. It has been developed by Luca Deri, an Italian research scientist and network manager at University of Pisa.
Also Ntop monitors and reports hosts traffic and supports these protocols:
TCP/UDP/ICMP
(R)ARP
IPX
DLC
Decnet
AppleTalk
Netbios
TCP/UDP
Installing Ntop
You can install ntop by running the following command:
sudo apt-get install ntop
During installation you will be asked to enter the password for the administrator. Simply enter your password and finish installation.

Figure: ntop installation
After installing ntop, start ntop service:
sudo /etc/init.d/ntop start

Figure: check ntop services
By default, ntop listens on port
3000 to display network usage via a web browser.
To verify ntop is working, run:
sudo netstat -tulpn | grep :3000
Figure: ntop port
You should see an output like the following:


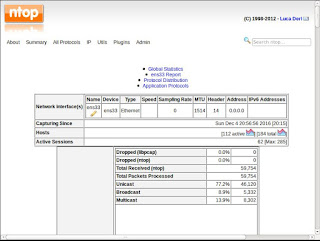
Figure: ntop graphical interface

Figure: host information

0 coments ::
Post a Comment